Since 2004 I have been heavily involved in the 2dF SDSS LRG and QSO (2SLAQ) survey, which used the 2dF instrument on the Anglo Australian Telescope (AAT) to obtain spectra of 13,000 LRGs with 0.45 < z < 0.7 and 6,000 QSOs over 180 degrees. I have used the LRG data from 2SLAQ and SDSS to show that the growth of these massive red galaxies is very slow since z=0.6, using measurements of both the luminosity function and clustering evolution (Wake et al. 2006, 2008a). I've also shown that radio loud LRGs live in more massive dark matter halos than identical radio-quite LRGs (Wake et al. 2008b). You can find some useful derived products from these papers such as the k+e corrections and completeness masks for the 2SLAQ LRGs here. More information on 2SLAQ along with both the LRG and QSO catalogues can be found at 2slaq.info. The figure on the right shows how LRGs occupy dark matter halos inferred from their clustering compared to predictions of semi-analytic galaxy formation models.
In order to investigate if we can see any evidence of faster evolution in these massive galaxies at earlier times, we have extended this work with the AUS survey. This time we are targeting LRGs with 0.7 < z < 1 again along side faint high redshift QSOs, highly reddened QSOs and radio sources using the upgraded
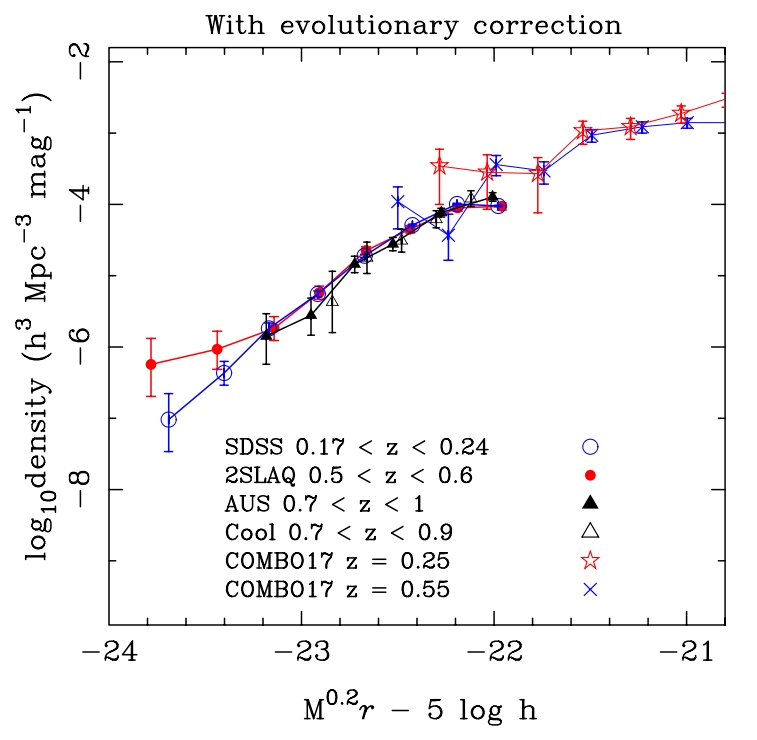
2dF-AAOmega spectrograph on the AAT. I am leading the LRG side of this project, with Scott Croom leading the QSO and radio galaxies. We make use of the deep coadded multi-epoch SDSS imaging in stripe82 as well as the UKIDSS LAS near-IR imaging to efficiently select our targets. We were awarded 39 nights as a large program for 2009-2001, and have 16 nights remaining in 2011B. So far we have obtained spectra of almost 4000 LRGs with a median redshift of 0.8. The figure shows the evolution of the luminosity function of LRGs at z < 1 including a correction for the passive dimming of an old stellar population. Data are included from SDSS, 2SLAQ and AUS and compared to results from the COMBO17 survey.
The primary aim of the
SDSS III BOSS survey is to constrain the dark energy equation of state by measuring the Baryon Acoustic Oscillation scale at z = 0.5 and z = 2.5. This will be achieved by measuring the clustering of 1.5 million LRGs at z < 0.7 and the clustering of the Lyman alpha forest in the spectra of 150,000 quasars. I am working on the LRG side of the survey which is targeting galaxies using the same methods we developed in 2SLAQ. The survey started taking data in August 2009 and already has spectra of almost 150,000 LRGs. The figure to the right shows a comparison between the project correlation functions of the SDSS, 2SLAQ and BOSS LRGs.
Following the evolution of massive passive galaxies above a redshift of one becomes very challenging, both because they become increasingly faint and also because their primary spectral features are redshifted into the near-IR. Obtaining redshifts for large numbers of z > 1 galaxies in the near-IR is almost impossible from the ground and so photometric redshifts have typically been used, but these typically have redshift errors of ~10%. We have addressed this problem in the NMBS by combining 5 medium band near IR filters with existing multi-band UV, optical and mid-IR imaging in the AEGIS and COSMOS fields. This allows us to obtain photometric redshifts with errors of ~2%, as well as star formation rates and stellar masses, for a mass limited galaxy sample out to z = 3. I am leading the clustering analysis and have made the first measurement of stellar mass dependent clustering at 1 < z < 2 (Wake et al. 2010).
We have just begun a program (NMBS-III, NOAO large program) to extend the medium-band near-IR filter coverage over a factor of 10 more area, but to a slightly shallower depth. This will allow us to identify the most massive galaxies at z=2, and will be particularly important for the clustering measurements, extending the mass range and greatly reducing cosmic variance effects.
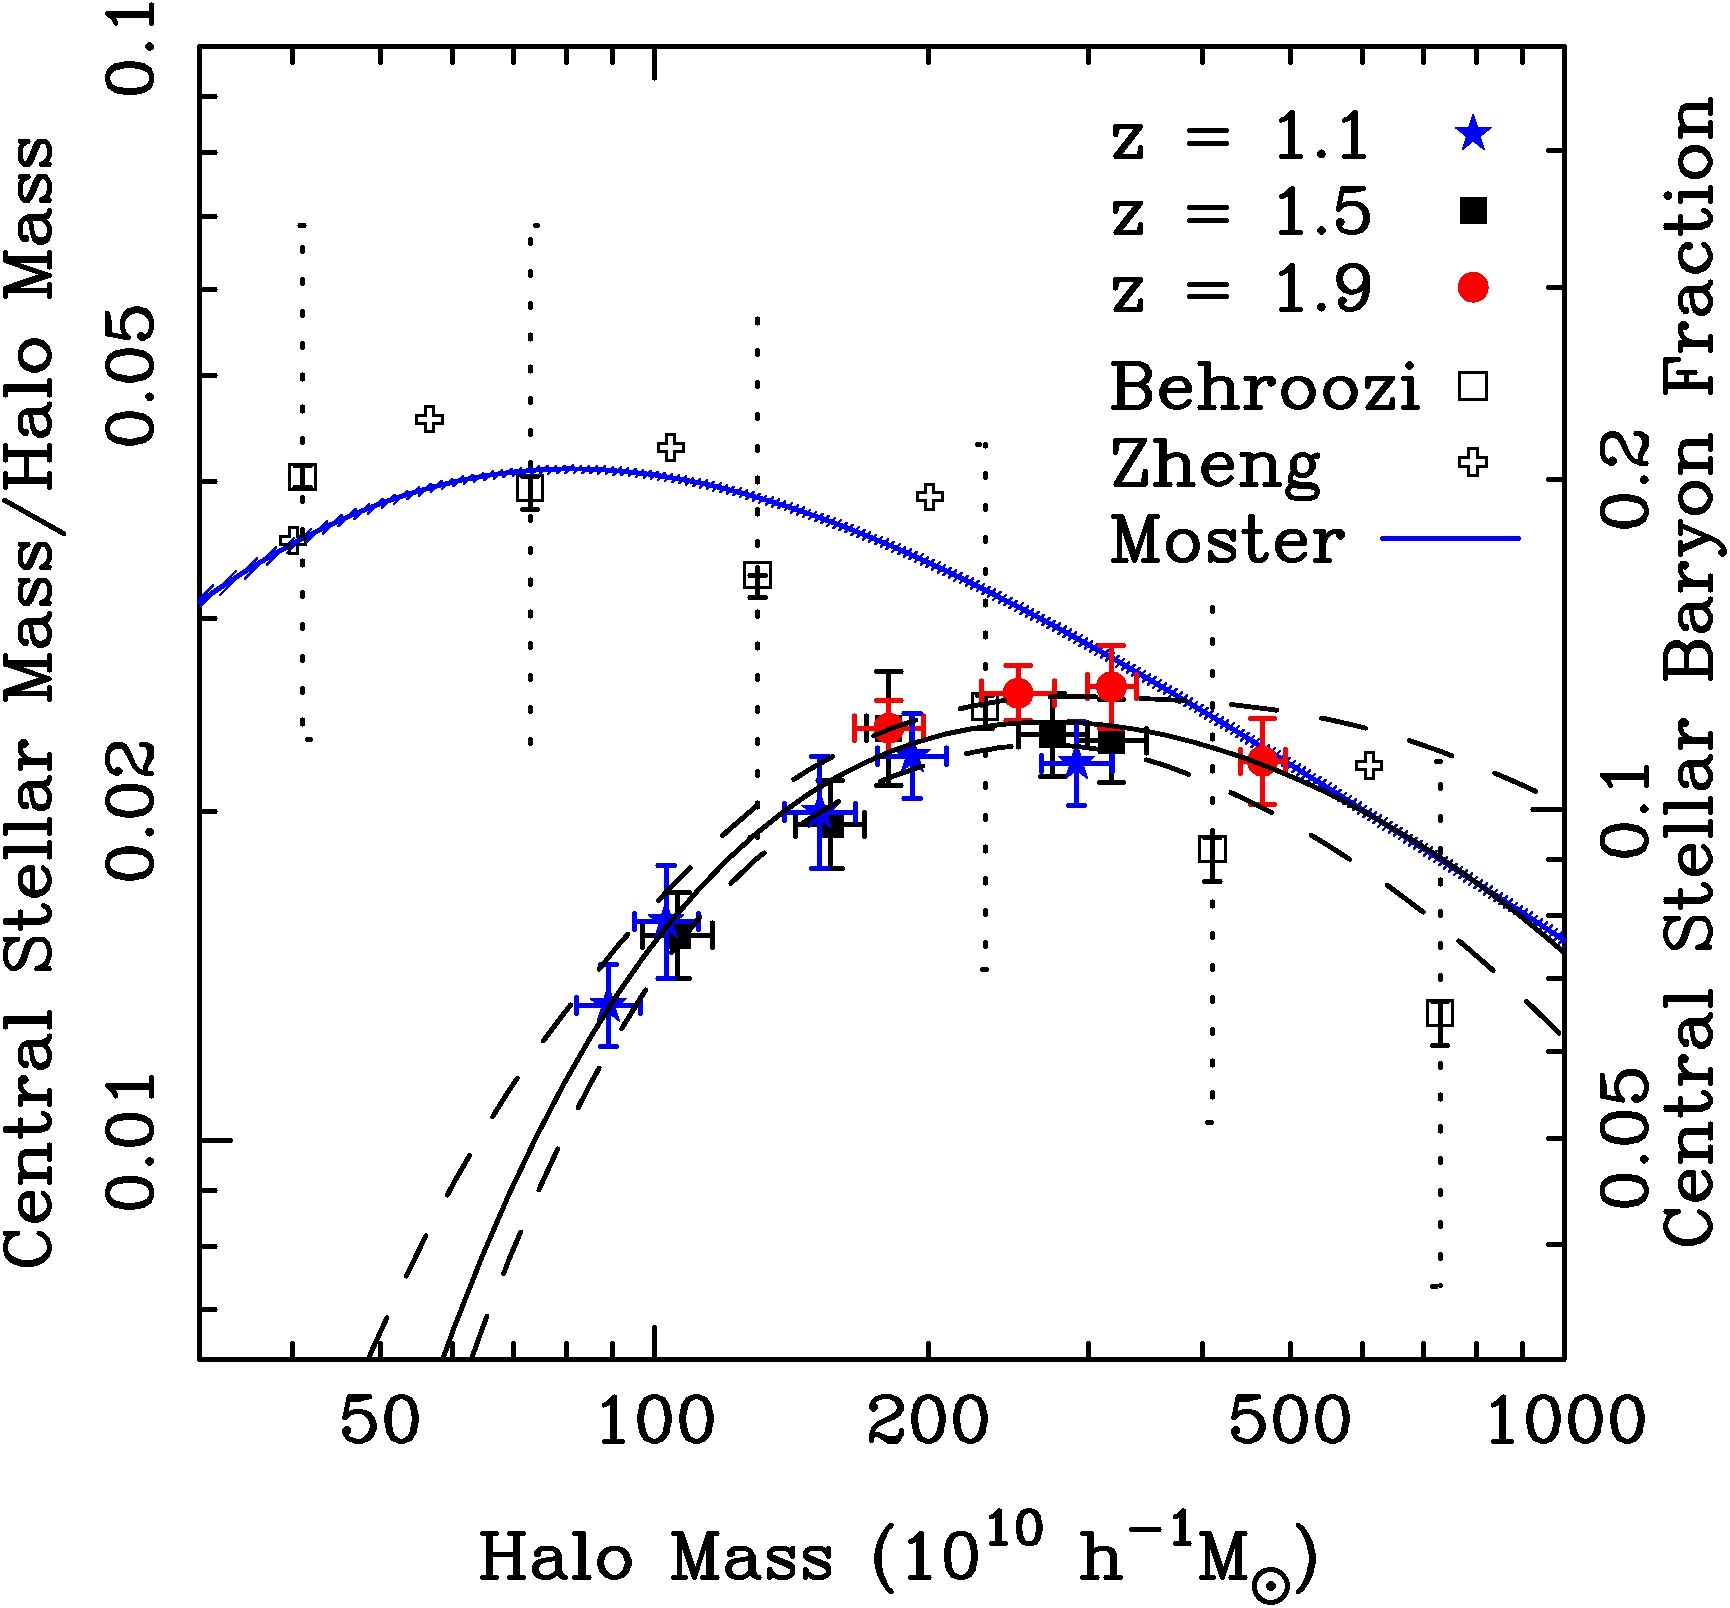
The figure shows the ratio of a galaxies stellar mass to the dark matter halo mass it occupies as a function of halo mass, inferred from clustering measurements at z < 2. This ratio indicates how efficiently baryons are converted into starts. The peak efficiency occurs in higher mass halos at higher redshift.
The only way to measure spectroscopic redshifts of large complete samples of z > 1.5 galaxies is from space based observatories. The recent installation of the WFC3 camera on the Hubble Space Telescope has for the first time made this possible. The 3dHST survey has just been awarded 248 orbits to undertake grism spectroscopy in the optical and near-IR over 713 square arcmins. This will provide spatially resolved spectra of a complete sample of ~9000 galaxies at 1 < z < 3.5, giving both redshift and spatially resolved stellar population measurements, increasing the number of such measurements by 2 orders of magnitude.
These spectra will allow us to tackle major questions on the growth of disks and bulges, the cause of the cessation of star formation in galaxies, and the role of environment and mergers in these processes at the epoch when most of the stars in the universe are being formed. I am leading the environmental analysis using both clustering and local density estimators, which benefit enormously in their precision due to the accuracy of the galaxy redshifts.
These data ares highly complimentary to the NMBS photometric surveys which cover a much larger volume of the universe and thus contain many more galaxies, but have less precise measures of an individual galaxies properties. The 3dHST spectral measurements can be used to accurately calibrate similar measurements being determined from the photometric data alone.
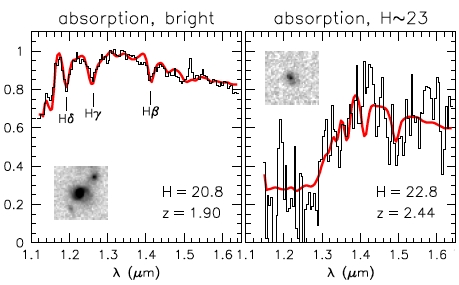
The figure shows example grism spectra of passive galaxies from the 1st field of 3dHST data for a bright galaxy (left) and a galaxy at our target limiting magnitude (right).