|
|
 |
Bottcher, M., et. al., 2007, ApJ, 670, 968-977
|
Bottcher, M., et. al., 2007, ApJ, 670, 968-977
|
Back to top
3C 279 Lightcurves
Radio Light Curve
Lahteenmaki, A. & Valtoaja, E., 2003, ApJ, 590, 95-108
|
Radio Light Curve
Robson, E., et. al., 2001, MNRAS, 327, 751-770
|
Radio Light Curve
Terasranta, H. et. al., 2005, A&A, 440, 409-410
|
Radio Light Curve
Radio light curves representing 5 GHz (black circles), 8 GHz (red squares), and 22 GHz (blue diamonds), respectively.
Bach, U., et. al., 2007, A&A, 464, 175-186
|
Radio/Optical Light Curve
Bottcher, M., et. al., 2007, ApJ, 670, 968-977
|
Optical Lightcurve (r)
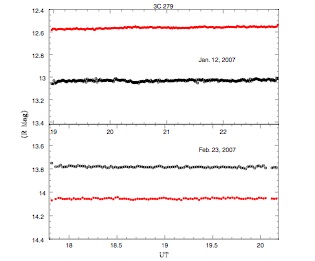
Gupta, A, 2008, ApJ, 135, 1384-1394
|
Gamma Ray Light Curve
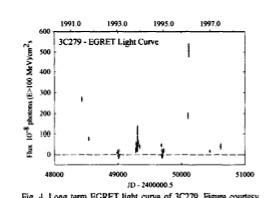
Instrument List: EGRET
Bottcher, M., 2007, ApJ, 670, 968
|
Gamma Ray Light Curve
Please see associated link for the Gamma Ray Light Curve
Teshima, M. et al, 2007, arXiv0709.1475T
|
Back to top
3C 279 Spectra
Optical Spectra
Evans, I. & Koratkard, A., 2004, ApJS, 150, 73-164
|
UV Spectra
Evans, I. & Koratkard, A., 2004, ApJS, 150, 73-164
|
Back to top
3C 279 Home
This page was last modified on 19 May 2009.
| |
|