
| Home |
| About |
| Targets |
| SMARTS |
| GLAST |
| Contact |
SMARTS Optical/IR Observations
|
X-ray Spectral Energy Distribution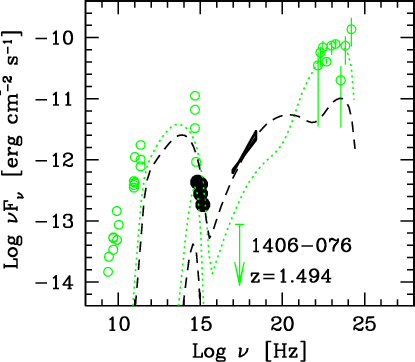 The black line is a single-zone synchrotron inverse Compton model using the input parameters referenced in the paper. XMM-Newton data are indicated with black filled symbols, the remaining symbols and lines are archival data. Foschini, L. et al., 2006, A&A, 453, 824-828 |
1406-076 Lightcurves
Radio Light Curve (37 Ghz)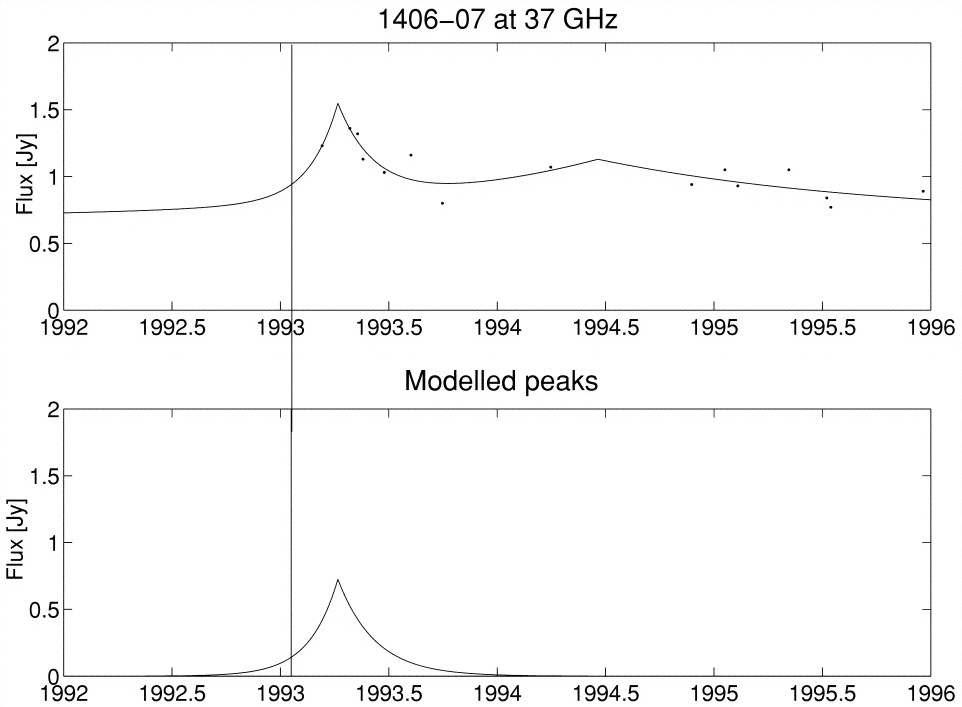 Lahteenmaki, A. and Valtoaja, E., 2003, ApJ, 590,95-108 |
Optical Light Curve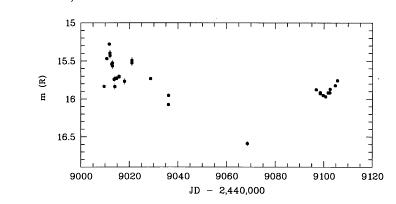 Wagner, S.J. et al., 1995, ApJL, 454, 97-100 |
Optical and Gamma Ray Light Curve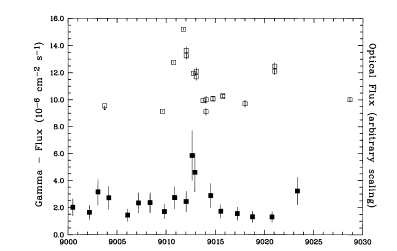 Wagner, S.J. et al., 1995, ApJL, 454, 97-100 |
Gamma Ray Light Curve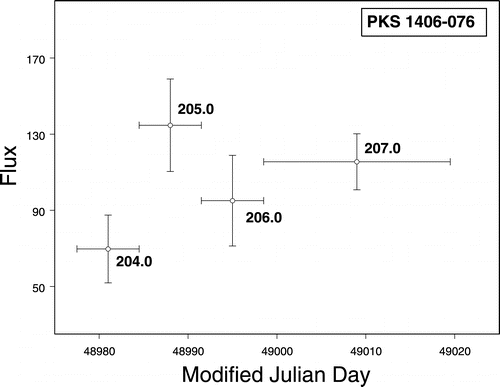 Instrument: EGRET Nandikotkur, G. et al., 2007, ApJ, 657 ,706-724 |
Gamma Ray Light Curve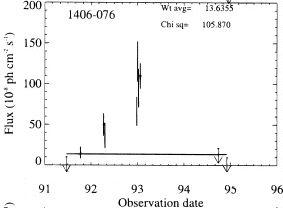 Gamma-ray light curve in the energy range 70MeV < E < 10 GeV during January 1993. Instrument: EGRET Mukherjee, R. et al., 1997, ApJ, 490, 116-135 |
Gamma Ray Light Curve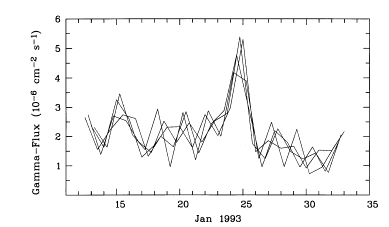 Wagner, S.J. et al., 1995, ApJL, 454, 97-100 |
1406-076 Spectra
Gamma Spectra (37 Ghz)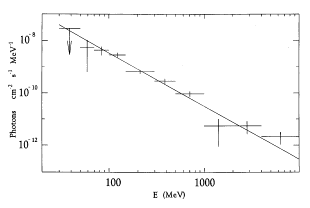 Gamma-ray spectrum in the EGRET energy range. Wagner, S.J. et. al., 1995, ApJL, 454, 97-100 |
1406-076 Home
This page was last modified on 19 May 2009.