|
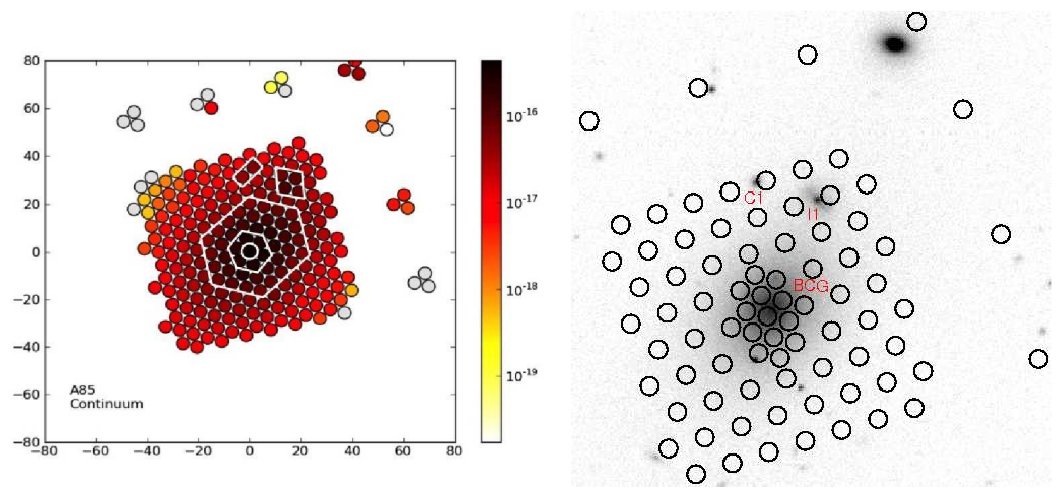
Integral Field Spectroscopy, allows for the detailed study of systems in both their spectral features, and morphological features. The image on the left is of Abell~85. The colour panel is a reconstructed image of the continuum emission. The BCG, some of its close companions, and the diffuse light in between can be observed. The instrument used is the Sparsepak fiber bundle on the WIYN telescope in Arizona. Each fiber (represented by a blue circle) collects an optical spectrum. Galaxy kinematics and emission and absorption line properties can subsquently be studied in detail. Edwards and a team of undergraduate students at Yale have been conducting a IFS survey of nearby BCGs in X-ray bright clusters.
The figure is from the theses of Hannah Alpert and Tara Abraham, and used in Edwards et al. 2016
More about the project can be found in this Research Note
|
|
|
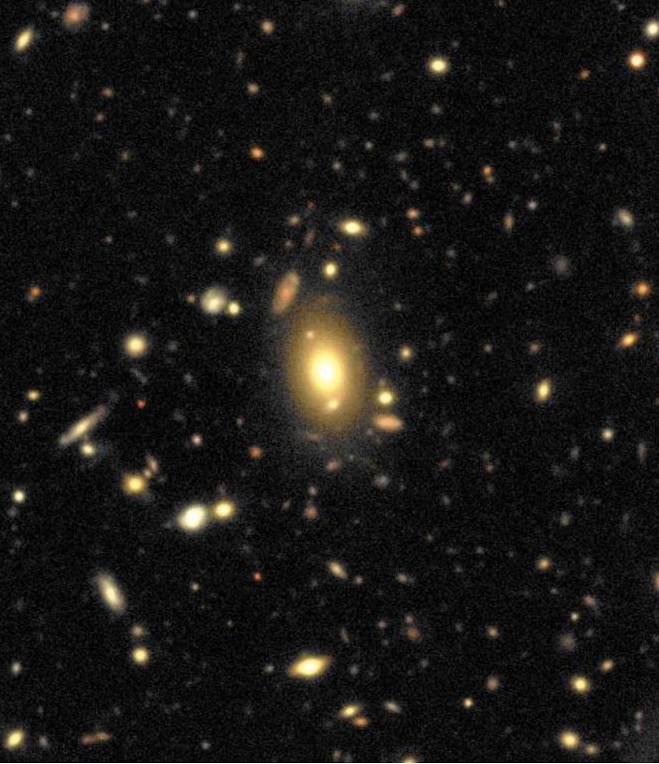
Brightest Cluster Galaxies are today's most massive galaxies and are found in a particularly dense environment. Local clusters house these galaxies in their cores, at the gravitational potential of the system. These clusters contain massive amounts of hot, X-ray emitting plasma. This X-ray plasma contains a significant fraction of the cluster's baryons, and often times a peak in the X-ray surface brightness is observed. This relates to a dip in the central temperatures and the system is then refered as having a 'cool core'. When BCGs in cool core clusters are found to be coincident with the X-ray centroid, these large, red, elliptical galaxies ("red and dead") often show bright optical emission lines. Some of the questions I am trying to answer are: What is the origin of this emission, and how is it related to the X-ray emitting gas? When did these massive galaxies produce the bulk of their stars? And, how imporant are major and minor mergers to the evolution of these galaxies?
The figure shows a large galaxy at the center of a rich cluster (z~0.25). The data from the Canadan-France-Hawaii Telescope's legacy survey. The figure was generated using Stephen Gwyn's graphical search tool.
|
|
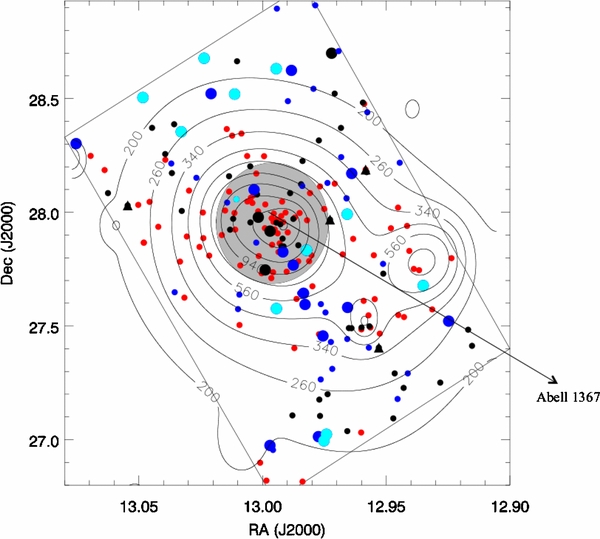
The Coma Cluster, having a redshift of about 0.023, is our nearest richregular galaxy cluster. As such, it allows for a level of detailed study currently unavailable for more distant clusters. The figure to the left shows the spatial distribution of star formation in the cluster core, out to the infall regions. The position of each of the spectroscopically confirmed infrared-emitting members on the sky is shown. After compiling up to 15 photometric bands, SED fitting allows us to estimate the galaxy colors, masses, and star formation rates. Red points are passive galaxies, black are low specific star formers, blue are normal star forming, and cyan are starburst. Before looking into possible effects of environment, it is important to identify the galaxies based on mass, as there is a strong correlation between star formation activity and galaxy mass. The dwarf galaxies are shown as large points, and galaxies with masses greater than a billion solar masses are smaller points. Seyfert galaxies are shown as black triangles. The gray circle highlights the core region of the cluster, the black rectangle marks the field of view of the Spitzer Space Telescope observations. Contours show the galaxy density, i.e., the number of red-sequence galaxies per square degree. As can be seen, the core has a dearth of starburst galaxies.
The figure is from Edwards & Fadda, 2011.
|
|
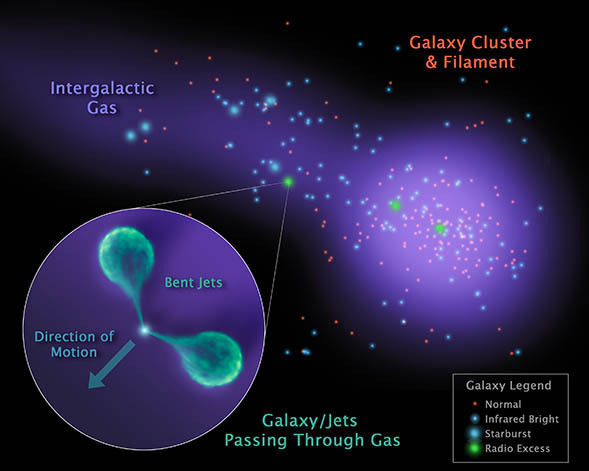
On the largest scales, cosmological simulations predict the structure of the universe consists of galaxies grouped in clusters, separated by voids, and connected by filaments. Observationally, deterining the properties of these filament galaxies is challenging, as it requires deep imaging of vast fields, and extensive spectroscopic followup to remove foreground and background galaxies. But this is possilbe with today's instrumentation. What happens when galaxies fall into clusters via filaments? What is the role of pre-processing in filaments? What is the baryon content of the WHIM (warm hot intergalactic medium) and how can we use filament galaxies to measure this?
This figure is based on data from Spitzer Space Telescope observations of Abell 1763 and follow up observations from Palomar, WIYN, and the Very Large Array. It illustrates the bending of radio lobes as a host galaxy travels through the hot gas of a cluster filament.
|
List of publications
|
| |
|
|