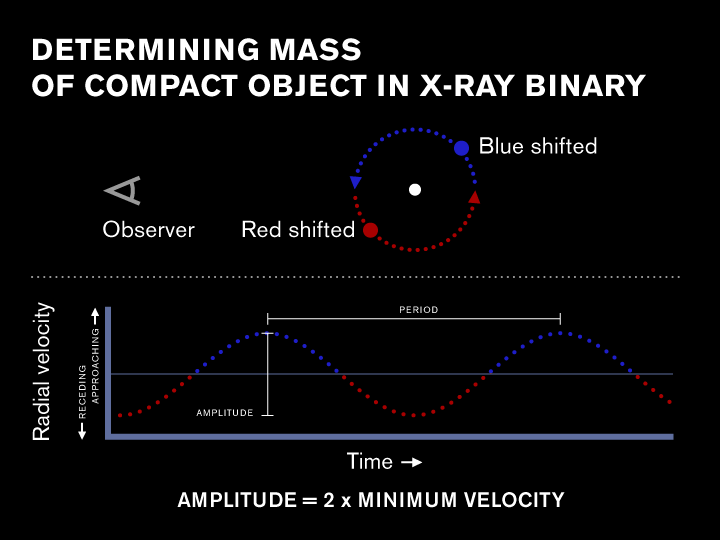
In binary stars we have two stars moving towards and away from us. Hence, the Binary Maker radial velocity plot shows two curves, one for each star. In the case of X-ray binaries, however, we can only see one star. If we were to take continuous measurements (spectra) of the visible star in the X-ray binary the radial velocity curve would look something like this:

(do not show title, "amplitude = ...", blue and red wrong way around on graph!)
Since the radial velocity curve repeats itself we have another way of measuring the orbital period of the binary.
The mean radial velocity, as shown by the horizontal grey line in the figure, is the systemic velocity. This is the velocity at which the entire binary system is moving with respect to our line of sight.
The maximum radial velocity at which our star is moving (K) is found by taking the amplitude of the curve and dividing by two.
Binary Maker shows the normalised radial velocity curve. That is, the program has subtracted the system velocity and divided the radial velocities so that the maximum is at 1.